Customer retention rate measures the percentage of customers who continue using your product or service over time. For B2B SaaS companies, retention directly impacts revenue growth, valuation multiples, and long-term sustainability.
This guide covers how to calculate customer retention rate accurately, industry benchmarks for 2025, and proven strategies to reduce churn and increase customer lifetime value.
What is Customer Retention Rate (CRR)?
Customer retention rate (CRR) is the percentage of customers who remain active subscribers or users over a specific time period, excluding new customers acquired during that period. It measures your ability to keep existing customers satisfied and engaged with your product.
Critical distinction: CRR only counts customers who were active at the start of the measurement period. New customers acquired during the period are excluded to provide an accurate view of how well you retain your existing base.
For example, if you start January with 100 customers, gain 30 new customers in January, and end January with 115 total customers, your retention calculation excludes the 30 new acquisitions. Your CRR reflects the 85 original customers who remained (85% retention), not the 115 total customers.
Why Customer Retention Rate Matters for Business Growth
Retention is More Profitable Than Acquisition
Acquiring new customers costs 5-25 times more than retaining existing ones. This cost disparity makes retention the most efficient lever for sustainable growth, particularly as customer acquisition costs continue rising across all industries.
Revenue impact of retention improvements:
- 5% increase in retention drives 25-95% increase in profits over time
- Repeat customers spend 31% more than new customers
- Existing customers have 60-70% likelihood of purchasing again vs. 5-20% for prospects
- Companies with strong omnichannel strategies retain 89% of customers vs. 33% for weak strategies
- Effective churn management delivers 16x ROI on retention investments
Retention Drives Net Revenue Retention (NRR)
Net Revenue Retention measures revenue growth from existing customers after accounting for churn, downgrades, and expansion. Top-performing B2B SaaS companies achieve NRR above 120%, meaning they grow 20% annually from their existing customer base alone without adding any new customers.
2025 NRR benchmarks:
- Industry average for SaaS: 109% NRR
- Top performers: 120%+ NRR (companies with superior support)
- Public SaaS companies: 110% median NRR
- Private SaaS companies: 101% NRR baseline for sustainable growth
- Technology companies: 101% median NRR
According to industry data, companies with superior customer support achieve 120%+ net revenue retention through support-driven expansion, while effective churn management delivers 16x ROI on retention investments.
Retention Predicts Customer Lifetime Value
Customer lifetime value (LTV) calculations depend heavily on retention rates. A customer retained for 24 months generates significantly more revenue than one who churns after 6 months, even after accounting for acquisition costs.
LTV impact example:
- Customer A: 90% annual retention, $1,000 annual value = $10,000 LTV
- Customer B: 70% annual retention, $1,000 annual value = $3,333 LTV
This 3x difference in LTV from a 20-point retention improvement dramatically affects unit economics, CAC payback periods, and overall business valuation.
Retention Provides Product-Market Fit Signals
Consistent retention indicates product-market fit, while declining retention suggests fundamental issues with value delivery, user experience, or market positioning. Retention trends reveal:
- Whether customers achieve desired outcomes from your product
- How sticky your solution is within customer workflows
- If perceived value justifies pricing
- Whether competition offers superior alternatives
For a comprehensive understanding of how retention fits within broader customer success metrics, track retention alongside engagement metrics, NPS, and feature adoption rates.
How to Calculate Customer Retention Rate: The Formula
The standard formula for customer retention rate:
CRR = ((Customers at End of Period - New Customers Acquired) / Customers at Start of Period) × 100
Step-by-Step Calculation Process
Step 1: Define your measurement period (week, month, quarter, year)
Step 2: Count customers at the start of the period
- Use your CRM, subscription management system, or billing platform
- Include only active, paying customers (or active users for freemium models)
- Establish clear criteria for "active" (e.g., paid subscription in good standing)
Step 3: Count total customers at the end of the period
- Include both original customers who remained and new customers acquired
- Use the same "active" definition as Step 2
Step 4: Count new customers acquired during the period
- Track only customers who became active during the measurement period
- Exclude reactivations of churned customers (track these separately)
Step 5: Apply the formula
Detailed Calculation Example
Your SaaS company's Q1 2025 data:
- Customers on January 1: 500
- Customers on March 31: 560
- New customers acquired in Q1: 85
Calculation:CRR = ((560 - 85) / 500) × 100CRR = (475 / 500) × 100CRR = 0.95 × 100CRR = 95% quarterly retention
Interpretation: You retained 475 of your original 500 customers (95%), losing 25 customers to churn. The 85 new customers brought total count to 560, but they don't factor into retention rate calculation.
Common Calculation Mistakes to Avoid
Mistake 1: Including new customers in the numeratorWrong: ((560 total customers) / 500) × 100 = 112% (impossible retention rate)Correct: ((560 - 85 new customers) / 500) × 100 = 95%
Mistake 2: Mixing customer definitionsDon't switch between "all signups" and "paying customers" mid-calculation. Maintain consistent definitions of what constitutes an active customer.
Mistake 3: Ignoring time period appropriatenessAnnual contracts shouldn't be measured monthly. Match measurement frequency to your business model and contract structure.
Mistake 4: Forgetting about seasonalityRetail, education, and tax software companies experience predictable seasonal patterns. Compare year-over-year periods rather than sequential months.
Calculate your customer retention rate and compare against industry benchmarks. Input your customer counts to see where you stand and identify improvement opportunities.
Customer Retention Rate vs. Related Metrics
Understanding how CRR differs from related metrics helps you track the complete picture of customer health:
CRR vs. Churn Rate: These are inverse metrics. If CRR is 92%, churn rate is 8%. Most companies track both to understand retention from different angles.
CRR vs. NRR: CRR counts customers (logos), while NRR measures revenue. You can have 90% CRR but 110% NRR if retained customers expand significantly. NRR provides better insight into economic value of retention.
CRR vs. User Retention: In B2B, CRR measures account/company retention, while user retention tracks individual users within those accounts. High user retention within accounts predicts strong CRR.
For detailed analysis of churn, see our guide on average churn rates for SaaS companies.
2025 Customer Retention Rate Benchmarks
B2B SaaS Churn and Retention Benchmarks
Monthly churn rates:
- Average B2B SaaS: 3.5% monthly churn
- Voluntary churn: 2.6% monthly (customers actively choosing to leave)
- Involuntary churn: 0.8% monthly (failed payments and billing issues)
- Enterprise customers: 1-2% monthly churn
- Small business customers: 3-5% monthly churn
Annual retention rates:
- Early-stage companies (<$300K ARR): 92% retention (8% annual churn is good)
- Scale-stage companies ($8M+ ARR): 95-97% retention (3-5% annual churn target)
- Average SaaS industry: 50-68% annual retention
- Companies lose 10-25% of customers annually on average
Impact of churn:
- 3% monthly churn = lose 50% of customers/revenue in 2 years
- 5% monthly churn = lose 85% of customers/revenue in 3 years
- First contact resolution improvements reduce churn by 67%
- AI implementation reduces churn by 10-15% over 18 months
- 46% of SaaS companies now use churn prediction models
For detailed analysis of what constitutes healthy churn rates by company stage, see our complete guide on average churn rates for SaaS companies.
Key Retention Factors by Customer Segment
Customer retention varies significantly based on contract value, customer segment, and business model:
Enterprise and High-Value Customers:
- Lower monthly churn (1-2%) due to deeper integrations and switching costs
- Higher retention from dedicated customer success relationships
- Longer sales cycles create more informed purchasing decisions
- Greater expansion revenue opportunities through upsells
SMB and Mid-Market Customers:
- Higher churn rates (3-5% monthly) due to business failures and budget constraints
- More price-sensitive, requiring clear value demonstration
- Benefit from product-led retention strategies
- Need scalable customer success approaches
Key retention drivers across segments:
- Product usage frequency and feature adoption depth
- Quality of customer support and response times
- Onboarding effectiveness in first 30 days
- Regular business reviews for strategic accounts
- Proactive issue detection before problems cause churn
For comprehensive customer support benchmarks including CSAT, NPS, and support metrics that impact retention, see our 2025 industry analysis.
User Retention Benchmarks by Timeframe
For product-led companies tracking user (not customer) retention:
30-Day User Retention:
- Average across all software: 39%
- Top quartile (75th percentile): 48%
- Best-in-class (90th percentile): 57%
60-Day User Retention:
- Average: 35%
- Top quartile: 43%
- Best-in-class: 52%
90-Day User Retention:
- Average: 30%
- Top quartile: 38%
- Best-in-class: 47%
These benchmarks apply to B2B software products tracking individual user engagement. About 60-70% of new users stop using products within the first 90 days without proper onboarding and activation.
Industry-Specific Retention Rates
Software/SaaS: 74-84% annual retentionProfessional Services: 84% (highest retention across industries)Media/Publishing: 84%IT Services: 81-83%Financial Services: 78-80%Healthcare Technology: 75-78%E-commerce Subscription: 70-75%
Professional services and media maintain highest retention due to relationship-based models and content lock-in effects.
For comprehensive customer support statistics and benchmarks across industries, including CSAT and NPS data, see our 2025 industry analysis.
How Often Should You Measure Customer Retention Rate?
Measurement frequency should align with your business model, contract structure, and growth stage:
Annual Measurement
Best for:
- Enterprise SaaS with annual or multi-year contracts
- High-touch sales models with long onboarding
- Established companies with stable customer bases
Why: Annual contracts make monthly retention measurements meaningless. Customers typically can't churn until renewal, making annual retention the only relevant metric.
Quarterly Measurement
Best for:
- Mid-market B2B SaaS with annual contracts
- Companies tracking cohort retention trends
- Businesses balancing growth and retention focus
Why: Provides regular visibility without over-indexing on noise. Quarterly reviews allow time for retention initiatives to show impact while catching problems before annual renewals.
Monthly Measurement
Best for:
- Month-to-month subscription models
- Product-led growth companies
- High-volume, lower-ARPA businesses
- Early-stage companies optimizing product-market fit
Why: Monthly measurement reveals patterns quickly and enables rapid iteration. Essential when customers can cancel anytime without penalty.
Cohort Retention Analysis
Regardless of your primary measurement frequency, analyze cohorts (groups of customers acquired in the same period) to understand:
- Which acquisition channels produce best retention
- How retention evolves over customer lifetime
- Whether product changes impact retention
- If specific customer segments retain better
Track retention curves showing percentage of each cohort remaining after 1 month, 3 months, 6 months, 12 months, etc. Healthy SaaS businesses see retention curves flatten after 12-18 months, indicating a stable, retained customer base.
What is a Good Customer Retention Rate?
Elite performance: 90%+ annual retention for B2B SaaSStrong performance: 85-90% annual retentionAverage performance: 75-85% annual retentionConcerning: Below 75% annual retention
However, "good" depends heavily on your specific context:
For Enterprise SaaS ($500+ ARPA):Target 90-95% annual retention. Enterprise customers have high switching costs, making 85% retention a warning sign of fundamental product or service issues.
For SMB SaaS ($50-$500 ARPA):Target 80-85% annual retention. SMBs churn more due to business failures (not just product dissatisfaction), making 75-80% acceptable.
For Consumer Subscription Products:Target 70-75% annual retention. Consumer products face lower switching costs and more competitive pressure, making high retention harder.
For Early-Stage Companies:Focus on retention curve shape over absolute numbers. Your first cohorts may show 60-70% retention, but if each subsequent cohort improves, you're heading toward product-market fit.
Red Flags in Retention Data
Declining retention over time: Each cohort retains worse than previous cohorts, suggesting competitive pressure or declining product value.
High early churn: More than 40% churn in first 90 days indicates onboarding failure or acquisition/product mismatch.
Accelerating churn: Churn rate increasing over customer lifetime (month 12 worse than month 6) suggests customers don't achieve lasting value.
Negative NRR with positive CRR: Customers stay but consistently downgrade, indicating price/value misalignment or feature bloat.
Can Customer Retention Rate Be Negative?
Yes, though it's rare and requires losing both existing customers and some portion of newly acquired customers during the measurement period.
Example of negative CRR:
- Start with 50 customers
- Acquire 200 new customers (250 total possible)
- End with 150 customers
- Lost 100 total customers (50 original + 50 new)
Calculation:CRR = ((150 - 200) / 50) × 100 = -100%
Negative retention indicates severe problems:
- Fundamentally broken onboarding that drives immediate churn
- Major product failures or outages
- Fraudulent or mismatched customer acquisition
- Business model issues causing rapid churn
If you calculate negative retention, immediately investigate acquisition quality, onboarding effectiveness, and core product value delivery.
15 Proven Strategies to Improve Customer Retention Rate
1. Master Customer Onboarding in the First 30 Days
Over 20% of voluntary churn links directly to poor onboarding. The first 30 days determine whether customers achieve enough value to justify continued subscription.
Onboarding best practices:
- Define clear "activation" milestones that predict retention
- Guide users to their "aha moment" within first session
- Use progressive disclosure to avoid overwhelming new users
- Implement product tours for complex features
- Set up automated email sequences for inactive users
- Assign customer success managers to high-value accounts
Activation metrics that predict retention:
- Completed core workflow within 7 days
- Invited team members within 14 days
- Used key feature 3+ times in first month
- Integrated with essential tools within 30 days
Companies with formal onboarding programs report 25% higher first-year retention compared to those relying on self-service only.
For more strategies on improving user engagement, see our guide on customer service efficiency.
2. Implement Proactive Customer Success Monitoring
Don't wait for customers to reach out with problems. Monitor health scores and intervene before churn risk materializes.
Health score components:
- Product usage frequency and depth
- Feature adoption rate
- Support ticket volume and sentiment
- Payment status and billing issues
- Engagement with emails and resources
- NPS or CSAT survey responses
Early warning indicators:
- 30%+ decrease in login frequency
- No activity for 7-14 days (for daily-use products)
- Multiple support tickets in short period
- Failed payments or billing disputes
- Low scores on satisfaction surveys
- Declining feature usage over time
Companies using health scoring see 6-12 point improvements in NRR by enabling early intervention before customers reach decision to churn.
Use tools like session replay to observe where customers struggle. Session replay and analytics tools reveal friction points invisible in traditional metrics.
3. Build Product-Led Retention Through Feature Adoption
Customers who adopt more features demonstrate significantly higher retention. Each additional feature used increases switching costs and deepens product integration into workflows.
Feature adoption strategies:
- Highlight underutilized features to active users
- Create in-app prompts for relevant features based on user behavior
- Develop feature-specific onboarding for advanced capabilities
- Use email campaigns to educate on specific features
- Implement feature discovery mechanisms in UI
Benchmark: Companies achieving 70%+ feature adoption see double the retention rates of those with 30-40% adoption.
Track "power user" behaviors (features, frequency, workflows) and guide other customers toward those patterns.
4. Deliver Exceptional Customer Support Experiences
68% of customers will pay more to work with companies known for excellent customer service. Support quality directly influences retention decisions.
Support metrics that impact retention:
- First response time under 4 hours for email, under 2 minutes for chat
- First contact resolution rate above 75%
- Customer satisfaction scores above 90%
- Average resolution time under 24 hours
Support strategies that improve retention:
- Implement omnichannel support (email, chat, phone, in-app)
- Use visual support tools like cobrowsing for complex issues
- Create comprehensive self-service knowledge bases
- Train support teams on proactive problem-solving
- Follow up after resolution to ensure satisfaction
For comprehensive tooling recommendations, see our analysis of the best customer support software in 2025.
5. Personalize Customer Experiences Based on Segments
One-size-fits-all approaches fail because different customer segments have different needs, usage patterns, and value drivers.
Segmentation dimensions:
- Company size and industry
- Use case and workflows
- Feature usage patterns
- Engagement level and tenure
- Expansion potential
- Support dependency
Personalization tactics:
- Segment-specific onboarding flows
- Customized email content and cadence
- Tailored in-app messaging
- Industry-specific resources and templates
- Persona-based feature recommendations
Personalized experiences drive 60% higher likelihood of repeat engagement and reduce churn by addressing specific segment needs.
6. Conduct Regular Business Reviews for High-Value Accounts
Quarterly Business Reviews (QBRs) maintain executive-level relationships and uncover expansion opportunities while addressing concerns before they become churn risks.
QBR best practices:
- Schedule 30-60 days before renewal for annual contracts
- Present ROI metrics and usage data
- Discuss customer goals and challenges
- Showcase new features relevant to customer
- Identify expansion opportunities naturally
- Document action items and follow through
Companies running regular QBRs report 33% higher expansion revenue and significantly lower silent churn (customers who plan to leave but haven't indicated it).
7. Implement Win-Back Campaigns for At-Risk Customers
Identify customers showing churn signals and intervene with targeted campaigns before they cancel.
Win-back campaign elements:
- Personalized outreach from customer success managers
- Special offers or discounts for at-risk accounts
- Additional training or consultation
- Product feature highlights addressing pain points
- Executive escalation for strategic accounts
Cancellation flow optimization:
- Understand cancellation reasons through surveys
- Offer alternatives to cancellation (pause, downgrade, discount)
- Make it easy to return if they do cancel
- Use exit surveys to improve for future customers
Exit surveys combined with smart offers reduce voluntary churn by 12-15%.
8. Build Customer Loyalty Programs
Incentivize long-term commitment through rewards, recognition, and exclusive benefits for loyal customers.
Loyalty program types:
- Point-based rewards for referrals and advocacy
- Tiered benefits based on tenure or spend
- Exclusive access to beta features or events
- Discounts for annual commitments
- Recognition programs for power users
More than 50% of customers say loyalty programs would motivate continued purchasing. Programs work best when rewards align with customer values (not just discounts).
9. Continuously Gather and Act on Customer Feedback
Regular feedback loops help you understand satisfaction levels, identify problems early, and demonstrate that you value customer input.
Feedback mechanisms:
- Post-onboarding surveys (7-30 days)
- Quarterly satisfaction surveys
- NPS surveys (quarterly or semi-annually)
- In-app feedback widgets
- Support interaction follow-ups
- Feature request voting systems
Critical: Close the feedback loop. Let customers know when you implement their suggestions. This builds trust and increases retention more than simply collecting feedback.
Track declining CSAT trends from individual accounts as churn predictors. Accounts with consistent low scores have 67% higher churn risk.
10. Optimize Pricing and Packaging for Value Alignment
Misaligned pricing creates churn. Customers who feel they're overpaying or not getting value for cost will leave.
Pricing strategies that improve retention:
- Usage-based pricing that scales with customer success
- Clear upgrade paths as customers grow
- Transparent pricing without surprise fees
- Flexible contract terms (monthly, annual, multi-year)
- Fair downgrade options to prevent complete cancellation
Value metric alignment: Price based on metrics that correlate with customer value received (users, transactions, storage) rather than arbitrary tiers.
Companies offering flexible, value-driven pricing see 8-12% higher retention than those with rigid tier structures.
11. Develop Strategic Integrations and Ecosystem Lock-In
Each integration with other tools in customer's stack increases switching costs and embeds your product deeper into workflows.
Integration priorities:
- CRM and marketing automation platforms
- Project management and collaboration tools
- Data warehouses and analytics platforms
- Payment processors and financial systems
- Communication platforms (Slack, Teams)
Customers using 3+ integrations show 40-50% lower churn rates than those using your product standalone.
12. Build Community and Enable Peer Learning
Customer communities create network effects that improve retention through peer support, knowledge sharing, and relationship building.
Community strategies:
- User forums for questions and best practices
- Slack or Discord communities for active users
- User conferences and local meetups
- Certification programs for power users
- Customer advisory boards for strategic input
Engaged community members demonstrate 2-3x higher retention rates than non-community participants.
13. Use AI and Automation to Scale Retention Efforts
Leverage technology to deliver personalized, timely interventions at scale without expanding customer success team headcount.
AI applications for retention:
- Churn prediction models identifying at-risk accounts
- Automated health scoring and alerting
- Personalized content recommendations
- Chatbots for instant support and guidance
- Automated renewal reminders and processes
For comprehensive analysis of AI tools, see our guide to the best AI customer service tools in 2025.
14. Fix Involuntary Churn Through Payment Optimization
Involuntary churn from failed payments accounts for 0.8% of monthly churn but is highly preventable. Companies lose 10% of revenue monthly due to declined cards and payment issues.
Payment optimization tactics:
- Automated card updater services
- Smart retry logic for failed payments
- Dunning campaigns via email and in-app notifications
- Grace periods before service suspension
- Alternative payment methods
Fixing involuntary churn lifts revenue by 8.6% in year one according to Recurly data. This is the fastest ROI improvement possible in retention.
15. Measure, Analyze, and Iterate Continuously
Retention improvement requires systematic measurement, analysis, and optimization over time.
Retention analytics to track:
- Cohort retention curves by acquisition source
- Retention rates by customer segment
- Correlation between engagement metrics and retention
- Impact of product changes on retention
- Effectiveness of win-back campaigns
Continuous improvement process:
- Weekly health score reviews for at-risk accounts
- Monthly retention metric reviews and trend analysis
- Quarterly retention initiative assessment
- Annual retention strategy planning
- Regular cohort analysis to identify patterns
Companies tracking retention weekly report consistent year-over-year improvements in both retention rates and customer lifetime value.
How Fullview Improves Customer Retention
Fullview helps software companies improve retention through visual support tools that reduce friction, accelerate problem resolution, and improve customer satisfaction.
Session Replay for Proactive Issue Detection
Monitor customer sessions to identify friction points, bugs, and confusion before customers churn. Session replay reveals:
- Where users get stuck during onboarding
- Features customers try to use but abandon
- Errors and performance issues affecting experience
- Workflow patterns of successful vs. at-risk customers
This visibility enables proactive intervention before problems cause churn.
Cobrowsing for Rapid Issue Resolution
When customers struggle, Fullview's cobrowsing enables support teams to see exactly what customers see and guide them to resolution in real-time. Benefits include:
- Faster resolution times (50-70% reduction)
- Higher first contact resolution rates
- Improved customer satisfaction scores
- Reduced support escalations
Rapid, effective problem resolution directly impacts retention by preventing frustration-driven churn.
Console Logs for Technical Troubleshooting
Real-time console logs and error monitoring help support and engineering teams diagnose and fix technical issues quickly, preventing product problems from driving churn.
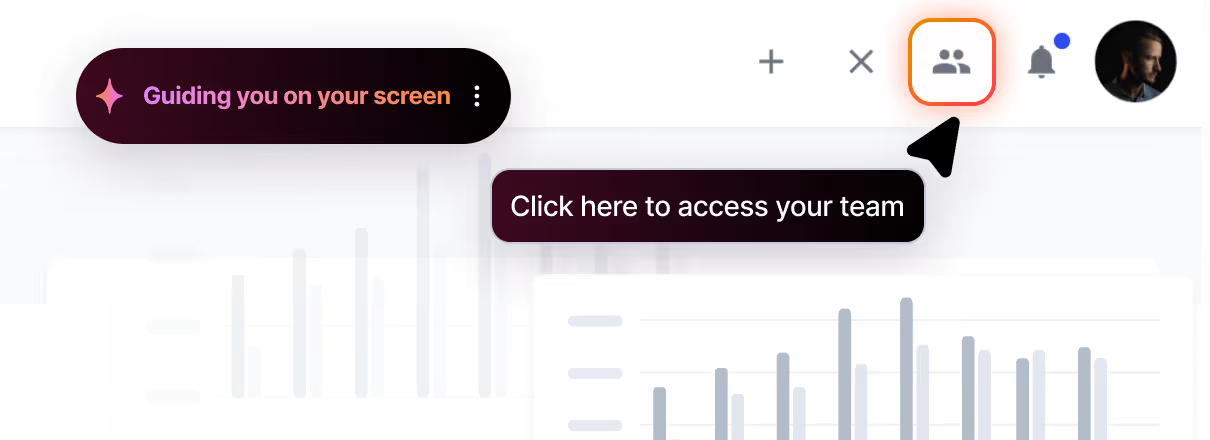
AI Agents for Self-Service Support
Fullview AI agents provide instant, accurate answers to common questions while offering visual guidance through complex workflows. This reduces dependency on human support while ensuring customers can successfully complete tasks.
Frequently Asked Questions About Customer Retention Rate
What is a good customer retention rate for B2B SaaS?
Top-performing B2B SaaS companies achieve 90-95% annual customer retention, while the industry median is approximately 74-85% depending on company size and ARPA. Enterprise SaaS with high ARPA typically targets 90%+ retention, while SMB-focused SaaS may accept 80-85% due to higher natural churn from business failures.
How is customer retention rate different from churn rate?
Customer retention rate and churn rate are inverse metrics. If you retain 85% of customers, your churn rate is 15%. Retention measures what you keep, while churn measures what you lose. Most companies track both to understand customer dynamics from different perspectives.
Should I include new customers when calculating retention rate?
No. Customer retention rate specifically excludes new customers acquired during the measurement period. Including new acquisitions inflates retention calculations and masks actual retention performance. The formula subtracts new customers from the end count before calculating the retention percentage.
How often should I calculate customer retention rate?
Measurement frequency depends on your business model. Annual contracts require annual measurement, while month-to-month subscriptions benefit from monthly tracking. Enterprise SaaS typically measures quarterly or annually, while product-led growth companies measure monthly or even weekly for rapid iteration.
What's the difference between customer retention rate and net revenue retention?
Customer retention rate (CRR) counts customers retained (logo retention), while net revenue retention (NRR) measures revenue growth from existing customers including expansion, downgrades, and churn. You can have 85% CRR but 110% NRR if retained customers significantly expand their spending through upsells and cross-sells.
Can customer retention rate be over 100%?
No. Customer retention rate cannot exceed 100% because it measures only customers present at the start of the period. New acquisitions are explicitly excluded. If your calculation shows above 100%, you've likely included new customers incorrectly. NRR can exceed 100% through expansion revenue, but CRR cannot.
What causes high customer churn in SaaS companies?
Primary churn drivers include poor onboarding (20%+ of voluntary churn), lack of perceived value, inadequate customer support, pricing misalignment, competitive alternatives, and product quality issues. For B2B specifically, involuntary churn from failed payments accounts for 0.8% of monthly churn and is highly preventable through payment optimization.
How do cohorts help analyze retention?
Cohort analysis groups customers acquired in the same time period and tracks their retention over time. This reveals whether retention improves or degrades with product changes, which acquisition channels produce best retention, and how long it takes for retention curves to flatten. Healthy SaaS businesses see retention curves stabilize after 12-18 months.
Conclusion: Focus on Retention for Sustainable Growth
Customer retention rate is one of the most critical metrics for subscription businesses. With customer acquisition costs rising and competition intensifying, keeping existing customers satisfied and engaged drives more profitable, sustainable growth than constantly acquiring new customers to replace churned ones.
The most successful companies:
- Measure retention consistently and track cohort trends
- Identify at-risk customers early through health scoring
- Invest heavily in onboarding to drive activation
- Use data to personalize experiences by segment
- Fix involuntary churn through payment optimization
- Scale retention efforts with AI and automation
Focus on delivering continuous value that justifies ongoing subscription, and retention will follow. A 5% improvement in retention can drive 25-95% profit growth over time, making retention optimization one of the highest-ROI activities in your business.
Ready to improve retention through better customer support? Fullview's session replay, cobrowsing, and AI agents help you identify friction, resolve issues faster, and keep customers successful.
.png)


.webp)