Net Revenue Retention (NRR) has become the defining metric for SaaS success in 2025. While customer acquisition dominated the growth-at-all-costs era, today's market demands sustainable, capital-efficient growth driven by existing customers.
Research shows that SaaS companies with high NRR grow 2.5 times faster than their low-NRR counterparts. For investors evaluating SaaS companies, NRR is often the single most important metric after revenue growth itself.
This comprehensive guide covers everything you need to know about calculating, benchmarking, and improving your Net Revenue Retention.
What is Net Revenue Retention (NRR)?
Net Revenue Retention (NRR), also known as Net Dollar Retention (NDR), measures how much recurring revenue a company retains and grows from its existing customer base over a specific period, typically monthly or annually.
NRR accounts for all revenue changes from existing customers:
- Expansions: Upsells, cross-sells, and additional seats or usage
- Contractions: Downgrades and reduced usage
- Churn: Complete customer cancellations
The simplest way to think about NRR: How much would your revenue grow or shrink if you landed zero new customers? That's your NRR.
Why NRR Matters More Than Ever in 2025
The SaaS landscape has fundamentally shifted since 2022. Customer acquisition costs have risen sharply, making new business more expensive and time-consuming. Meanwhile, investors now prioritize capital-efficient growth over growth at all costs.
Key reasons NRR is critical:
- Predicts sustainable growth: Companies with NRR above 110% can grow significantly without new customer acquisition
- Stronger valuation indicator: High-NRR companies command premium valuations because they demonstrate sustainable revenue streams
- More cost-effective than acquisition: Retaining and expanding existing customers costs 5 times less than acquiring new ones
- Compounds over time: High NRR creates compounding growth effects that accelerate as your customer base scales
- Reveals product-market fit: NRR above 100% indicates customers see enough value to stick around and invest more
- Attracts investors: NRR is increasingly the primary metric investors examine when evaluating SaaS companies
NRR vs GRR vs Churn Rate: Key Differences
Understanding how these metrics relate helps you diagnose retention issues:
Important distinction: GRR cannot exceed 100% because it excludes expansion revenue. NRR can exceed 100% (and should for most SaaS companies) because expansion more than offsets churn and contractions.
For more on customer success metrics and how they work together, explore our comprehensive guide.
How to Calculate Net Revenue Retention (NRR)
The NRR Formula
The standard NRR formula is:
NRR = (Starting MRR + Expansion MRR - Contraction MRR - Churn MRR) / Starting MRR × 100
Components you need:
- Starting MRR: Monthly recurring revenue at the beginning of the period from existing customers (excludes new customers acquired during the period)
- Expansion MRR: Additional revenue from upsells, cross-sells, and usage increases from existing customers
- Contraction MRR: Revenue lost from downgrades or reduced usage by existing customers
- Churn MRR: Revenue lost from customers who canceled completely
NRR Calculation Example
Let's calculate NRR for April 2025:
Starting Position (March 31):
- Starting MRR from existing customers: $100,000
April Activity:
- Expansion MRR (upsells/cross-sells): $25,000
- Contraction MRR (downgrades): $8,000
- Churn MRR (cancellations): $7,000
Calculation:
NRR = ($100,000 + $25,000 - $8,000 - $7,000) / $100,000 × 100
NRR = $110,000 / $100,000 × 100
NRR = 110%
This 110% NRR means you grew revenue from existing customers by 10% in one month, even after accounting for all churn and downgrades.
How to Calculate Gross Revenue Retention (GRR)
For comparison, GRR uses this formula:
GRR = (Starting MRR - Contraction MRR - Churn MRR) / Starting MRR × 100
Using the same example:
GRR = ($100,000 - $8,000 - $7,000) / $100,000 × 100
GRR = $85,000 / $100,000 × 100
GRR = 85%
This GRR of 85% reveals that 15% of revenue was lost to churn and downgrades. The 110% NRR shows expansion revenue ($25,000) more than offset those losses.
Why track both: A strong upsell motion can mask underlying retention problems. If your NRR is 110% but GRR is 70%, you have a serious churn problem that expansion is temporarily covering up.
Free NRR Calculator
Use our free calculator to automatically compute your Net Revenue Retention. Input your starting MRR, expansion, contraction, and churn figures to instantly see your NRR and how it compares to industry benchmarks.
Net Revenue Retention Benchmarks for 2025
What is a Good NRR for SaaS?
NRR benchmarks vary significantly by company stage, customer segment, and average contract value (ACV). Here are the current standards:
Overall SaaS Benchmarks:
- Below 100%: Poor - Revenue shrinking from existing customers, immediate action needed
- 100-105%: Fair - Maintaining revenue but limited growth from expansion
- 106-115%: Good - Solid baseline with meaningful expansion offsetting churn
- 116-120%: Very Good - Strong expansion engine driving growth
- 120%+: Excellent - Best-in-class expansion and retention
NRR Benchmarks by Company Stage (2025)
Early Stage ($1M-$3M ARR):
- Median NRR: 94-98%
- Top quartile: 99-104%
- Challenge: Still finding product-market fit, churn naturally higher
Growth Stage ($3M-$15M ARR):
- Median NRR: 99-104%
- Top quartile: 106-110%
- Focus: Solidifying retention while building expansion motion
Scale Stage ($15M-$30M ARR):
- Median NRR: 104-106%
- Top quartile: 110-115%
- Advantage: Established processes for retention and expansion
Mature ($30M+ ARR):
- Median NRR: 106-110%
- Top quartile: 115-120%
- Goal: Sustaining high NRR at scale
NRR Benchmarks by Average Contract Value (2025)
Contract size dramatically impacts NRR expectations:
$0-$5K ACV (SMB):
- Median NRR: 95-100%
- Top quartile: 105-108%
- Challenge: High churn volume, limited expansion opportunity per customer
$5K-$10K ACV:
- Median NRR: 100-102%
- Top quartile: 108-111%
- Sweet spot: Balance of manageable churn and expansion potential
$10K-$25K ACV:
- Median NRR: 102-106%
- Top quartile: 111-115%
- Advantage: Strong expansion motion, lower relative churn
$25K-$50K ACV:
- Median NRR: 102-106%
- Top quartile: 111-115%
- Benefit: Sticky customers with meaningful expansion paths
$50K-$100K ACV:
- Median NRR: 105-110%
- Top quartile: 115-120%
- Premium: Enterprise stickiness drives retention
$100K+ ACV (Enterprise):
- Median NRR: 110-115%
- Top quartile: 120-130%
- Best-in-class: Long sales cycles and implementation create high switching costs
Key NRR Statistics for 2025
Understanding these benchmarks helps contextualize your performance:
- Median NRR for private SaaS companies is 101-106% (down from 109% in 2021)
- Public SaaS companies average 110-114% NRR (down from 120% in 2022)
- Top 25% of SaaS companies achieve 115-120% NRR
- Best-in-class companies (Snowflake, Twilio) maintain 140-160% NRR
- Companies with high NRR grow 2.5x faster than low-NRR counterparts
- SaaS companies with NRR above 110% and low CAC payback achieve 71% average growth rates
- 40% of growth for companies with $15M-30M+ ARR now comes from expansion (up from 30% in 2021)
- Achieving 100%+ NRR is more difficult across all ARR ranges in 2025 than it was in 2021
- Even top quartile companies with $15M-$30M ARR struggle to reach 100% NRR consistently
- Bootstrapped SaaS companies ($3M-$20M ARR) show median NRR of 104% with 90th percentile at 118%
For more SaaS metrics and benchmarks, including churn rates and customer retention data, check out our comprehensive statistics guide.
Notable SaaS Company NRR Examples
Public Company Benchmarks:
- Snowflake: 158% NRR
- Twilio: 155% NRR
- Elastic: 142% NRR
- PagerDuty: 139% NRR
- AppDynamics: 123% NRR
- Datadog: 130% NRR
- Zoom: 130% NRR (pre-pandemic baseline)
These companies demonstrate that exceptional NRR (130%+) is achievable at scale with strong product-market fit and effective expansion strategies.
How Often to Calculate NRR
Measurement Frequency Best Practices
Monthly NRR (Most Common):
- Best for tracking trends and identifying issues quickly
- Allows rapid iteration on retention and expansion strategies
- Can be noisy month-to-month, so watch 3-month rolling averages
- Recommended for companies with monthly or annual contracts
Quarterly NRR:
- Smooths out monthly volatility
- Aligns with board reporting cycles
- Useful for companies with quarterly business reviews
- Good balance between responsiveness and stability
Annual NRR:
- Traditional benchmark for comparing to industry standards
- Required for investor reporting and valuation discussions
- Most stable measure but too slow for operational improvements
- Best used alongside monthly/quarterly tracking
Best Practice: Track monthly for internal operations, report quarterly to your board, and benchmark annually against industry standards.
Why Net Revenue Retention is Critical for SaaS
NRR Directly Impacts Valuation
Investors increasingly value growth quality over growth rate alone. Companies with high NRR command premium valuations because they've proven:
- Revenue is sustainable and not dependent on constant new customer acquisition
- Product delivers ongoing value that justifies price increases and expansions
- Customer success and product teams can drive growth without massive sales investment
- Growth compounds efficiently as the customer base scales
Valuation impact: A company with 120% NRR may command 2-3x higher valuation multiple than an equivalent company with 95% NRR, even at similar growth rates.
NRR Reveals True Business Health
New MRR growth can mask serious retention problems. A company adding $50K in new MRR monthly while losing $45K to churn looks healthy on the surface but has fundamental issues.
NRR reveals:
- Whether customers see ongoing value in your product
- If your pricing aligns with delivered value
- How effective your customer success team is
- Whether product improvements are resonating
- If you have product-market fit at scale
NRR Enables Capital-Efficient Growth
The shift from "growth at all costs" to "efficient growth" makes NRR more important than ever:
- Lower CAC dependency: High NRR reduces pressure on expensive acquisition channels
- Predictable revenue: Existing customer revenue is more predictable than new pipeline
- Expansion leverage: Growing existing accounts requires less investment than acquiring new ones
- Cash flow positive faster: Companies with 110%+ NRR reach profitability with lower burn
NRR Increases Customer Lifetime Value
NRR directly impacts CLV through two mechanisms:
- Longer retention: Customers staying longer increase CLV proportionally
- Revenue expansion: Upsells and cross-sells multiply the value of retained customers
A customer with $10K initial ACV who stays 3 years at flat pricing has $30K CLV. That same customer expanding to $15K in year 2 and $20K in year 3 has $45K CLV - 50% higher from expansion alone.
NRR Drives Compounding Growth
High NRR creates a compounding effect:
Year 1: $1M ARR, 120% NRR → $1.2M from existing customersYear 2: $1.2M base, 120% NRR → $1.44M from original cohort (44% growth)Year 3: $1.44M base, 120% NRR → $1.73M from original cohort (73% growth)
This compounding effect accelerates as your customer base grows, creating exponential growth trajectories for high-NRR companies.
15 Proven Strategies to Improve Net Revenue Retention
1. Deploy AI-Powered Customer Support Agents
Modern AI agents can resolve issues instantly, 24/7, without human intervention. This dramatically improves customer satisfaction and reduces churn-inducing friction.
Impact on NRR: Companies using autonomous AI support see 20-40% faster resolution times and 15-25% higher CSAT scores, both directly correlated with improved retention.
Action steps:
- Implement AI chatbots for instant resolution of common questions
- Deploy AI agents with visual guidance capabilities for complex software issues
- Use conversational AI for 24/7 availability across time zones
- Enable seamless escalation to human agents for complex cases
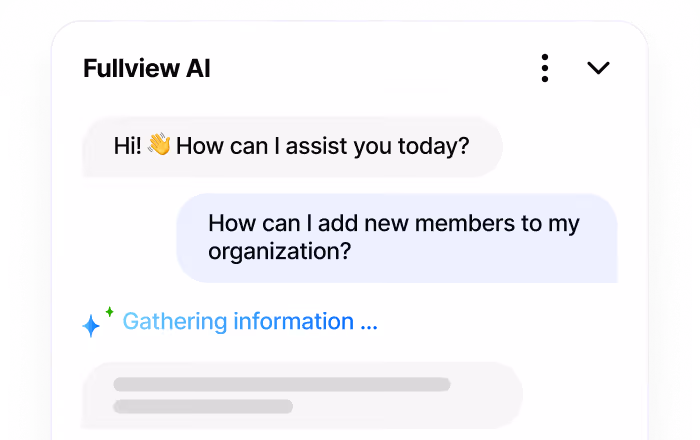
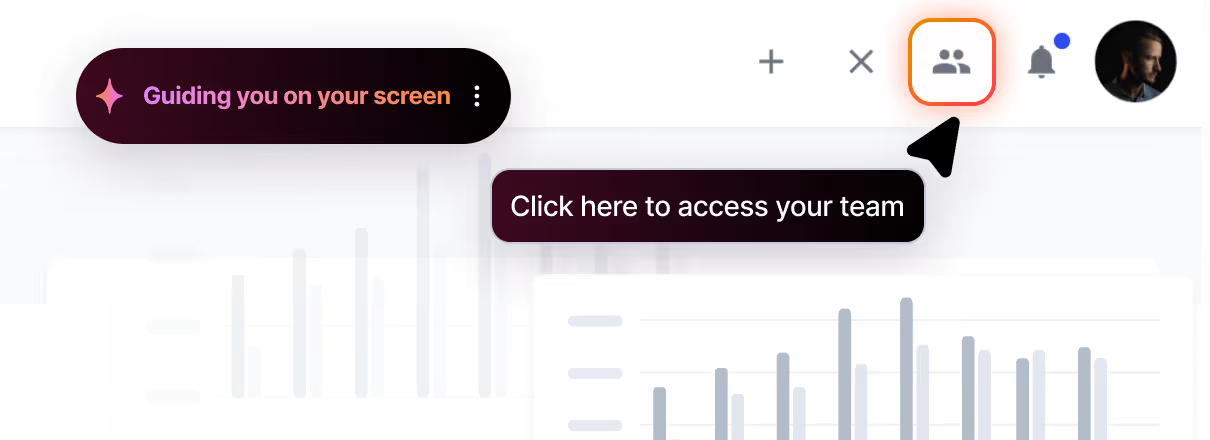
For software companies, AI agents that can actually see applications and provide step-by-step visual guidance on users' screens provide the most impact on retention - going beyond traditional text-only chatbots to show users exactly what to do.
2. Optimize Onboarding with Intelligent Guidance
First impressions matter enormously. Customers who reach their "aha moment" faster are significantly more likely to renew and expand.
Impact on NRR: Improved onboarding can increase first-year retention by 25%.
Action steps:
- Create personalized onboarding flows based on user role and goals
- Use AI to generate customized tutorials for different use cases
- Implement progress tracking with clear milestones
- Provide proactive guidance when users struggle during onboarding
- Measure time-to-value and optimize relentlessly
3. Implement Proactive Churn Prevention with AI
Don't wait for customers to cancel. Identify at-risk customers weeks or months before they churn and intervene proactively.
Impact on NRR: Early intervention can prevent 30-50% of potential churn.
Action steps:
- Use AI to analyze behavioral signals (login frequency, feature usage, support tickets)
- Assign churn risk scores to each customer automatically
- Create automated workflows to engage at-risk customers
- Monitor product usage patterns for early warning signs
- Set up alerts for customer success teams when risk scores spike
4. Build Expansion Opportunities into Your Product
Don't rely solely on sales teams for upsells. Your product should naturally guide customers toward expansion.
Action steps:
- Implement usage-based pricing that grows with customer success
- Create clear product tiers with obvious upgrade paths
- Show users how additional features solve their problems
- Add seat-based pricing for team collaboration features
- Build in-app prompts when users hit plan limits
- Track feature adoption to identify expansion-ready customers
5. Develop a Robust Customer Health Score System
You can't improve what you don't measure. Comprehensive health scoring helps you prioritize retention efforts.
Action steps:
- Track product engagement metrics (DAU/MAU, feature adoption, session length)
- Monitor support interactions (ticket volume, satisfaction scores, first response time)
- Measure business outcomes customers achieve with your product
- Create automated alerts for declining health scores
- Segment customers by health score for targeted interventions
6. Collect and Act on Customer Feedback Systematically
AI-powered sentiment analysis can process feedback across all touchpoints and identify patterns human teams might miss.
Action steps:
- Deploy automated surveys at key touchpoints (post-onboarding, quarterly, pre-renewal)
- Use AI to analyze support tickets, chat logs, and reviews for sentiment
- Create feedback loops from customer success to product teams
- Close the loop with customers who provide feedback
- Track and act on NPS, CSAT, and CES scores
7. Offer Strategic Discounts for Longer Commitments
Annual and multi-year contracts significantly improve GRR and provide expansion opportunities throughout the contract term.
Action steps:
- Offer 15-20% discounts for annual prepayment
- Create multi-year contract incentives
- Bundle expansion credits into longer contracts
- Make annual billing the default option
- Use monthly pricing as a discovery path to annual conversion
8. Create a Customer Community and Support Ecosystem
Customers who feel connected to your community are less likely to churn and more likely to expand.
Action steps:
- Build a user community forum for peer-to-peer support
- Host regular webinars and training sessions
- Create a customer advisory board for your best customers
- Develop certification programs for power users
- Organize user conferences (virtual or in-person)
9. Continuously Add Product Value
The moment you stop improving, competitors catch up and customers question their investment.
Action steps:
- Release new features quarterly that solve customer problems
- Communicate product updates clearly and demonstrate value
- Gather feature requests and prioritize based on revenue impact
- Sunset features that create maintenance burden without value
- Measure feature adoption rates to guide development priorities
10. Implement Tiered Customer Success Based on Value
Not all customers need the same level of attention. Segment your approach based on revenue and expansion potential.
Action steps:
- High-touch for enterprise customers: Dedicated CSMs, quarterly business reviews, strategic planning
- Mid-touch for mid-market: Pooled CSM resources, monthly check-ins, group training
- Low-touch for SMB: Automated onboarding, self-service resources, AI-powered support
- Track customer health across all segments
- Be prepared to escalate attention when churn signals appear
11. Use AI-Powered Upsell Triggers
AI can identify the perfect moments for expansion conversations based on usage patterns, achieved outcomes, and engagement signals.
Action steps:
- Track usage thresholds that indicate expansion readiness
- Monitor for team growth signals (new logins, role additions)
- Identify customers achieving key outcomes
- Automate outreach when expansion signals fire
- Personalize upsell messages based on customer behavior
12. Reduce Friction in Upgrade Processes
Every friction point between "I want to upgrade" and "upgrade complete" costs you expansion revenue.
Action steps:
- Enable self-service upgrades directly in your product
- Make plan comparisons clear and benefit-focused
- Remove unnecessary approval workflows
- Provide instant access to new features upon upgrade
- Track and optimize upgrade conversion rates
13. Address Failed Payments Proactively
Failed payments account for significant involuntary churn. Handle them systematically to preserve revenue.
Action steps:
- Send immediate notifications when payments fail
- Provide 7-14 day grace periods before service interruption
- Enable easy payment method updates in-app
- Try multiple payment retry schedules automatically
- Reach out personally for high-value accounts
14. Build Integrations That Create Lock-In
The more your product integrates into customers' workflows, the higher the switching cost and the lower the churn.
Action steps:
- Prioritize integrations with common tools in your customer's stack
- Build deep integrations, not superficial connections
- Make integration setup simple and quick
- Track which integrations correlate with higher retention
- Promote integration adoption during onboarding
15. Leverage Data Analytics to Identify What's Not Working
AI-powered analytics can surface patterns in churn, contraction, and expansion that human analysis might miss.
Action steps:
- Analyze churn patterns by customer segment, industry, and use case
- Identify features or workflows that correlate with churn
- Track contraction triggers to prevent downgrades
- Study expansion patterns in high-performing accounts
- Create dashboards for ongoing retention monitoring
For more retention strategies, explore our guide on how to reduce customer churn.
How to Analyze NRR Data Effectively
Segment Your NRR Analysis
Don't just track overall NRR. Segment by:
- Customer size: Enterprise, mid-market, SMB
- Industry vertical: Different industries may have different retention patterns
- Acquisition channel: How customers found you affects retention
- Contract length: Annual vs monthly contracts behave differently
- Product tier: Different plans may have vastly different NRR
- Customer age: Cohort analysis reveals retention trends over time
Segmentation reveals: You might have 105% overall NRR but discover enterprise customers are at 125% while SMB is at 85%. This changes your strategy entirely.
Conduct Cohort Analysis
Track how NRR evolves for customer cohorts over time:
Month 1: New customers onboardMonths 2-6: Early adoption phase, potential early churnMonths 7-12: Stabilization period, expansion opportunities emergeYear 2+: Mature relationship, highest expansion potential
Understanding cohort behavior helps you predict future NRR and identify improvement opportunities.
Monitor Leading Indicators
NRR is a lagging indicator. Track these leading indicators to predict NRR changes:
- Product usage trends (DAU/MAU ratios)
- Feature adoption rates
- Customer Effort Score and CSAT trends
- Support ticket volume and sentiment
- Invoice payment speed
- Customer health score trajectories
- Time to first value and ongoing value realization
Compare NRR to GRR
The gap between NRR and GRR reveals your expansion engine's strength:
- Wide gap (NRR 120%, GRR 85%): Strong expansion but concerning churn that expansion masks
- Narrow gap (NRR 102%, GRR 97%): Solid retention but limited expansion opportunity
- Healthy balance (NRR 115%, GRR 92%): Good retention with meaningful expansion
Action based on gap: If your gap is too wide, focus on improving GRR before pushing expansion harder.
Connect NRR to Business Outcomes
Prove NRR's business impact by correlating with:
- Growth rate: High NRR companies grow faster
- CAC payback period: NRR affects how quickly you recover acquisition costs
- Valuation multiples: Investors pay more for high-NRR companies
- Profitability: High NRR reduces pressure on expensive acquisition
- Cash flow: Predictable retention and expansion improve cash flow stability
Common Mistakes When Managing NRR
Mistake 1: Focusing Only on NRR While Ignoring GRR
The problem: Strong expansion can mask serious retention issues. Companies celebrating 120% NRR may miss that they're losing 30% of revenue to churn.
The fix: Track GRR alongside NRR. If GRR is below 85%, focus on retention before pushing expansion harder.
Mistake 2: Not Segmenting NRR by Customer Type
The problem: Blended NRR hides critical patterns. Your enterprise segment might be thriving (130% NRR) while SMB is collapsing (70% NRR).
The fix: Analyze NRR by customer segment, ACV band, industry, and acquisition channel. Build separate strategies for different segments.
Mistake 3: Relying on Discounting to Prevent Churn
The problem: Discounting saves individual customers short-term but creates longer-term revenue contraction and sets bad precedents.
The fix: Address root causes of churn risk instead of applying discounts. If you must discount, require longer commitments or expansion in return.
Mistake 4: Starting Retention Efforts Too Late
The problem: Waiting until renewal conversations to engage at-risk customers means you're already behind. Most churn decisions happen months before cancellation.
The fix: Implement early warning systems and intervene at first signs of health score decline.
Mistake 5: Over-Rotating to Expansion Without Fixing Retention
The problem: Pushing upsells on unhappy customers accelerates churn rather than preventing it.
The fix: Ensure baseline health and satisfaction before expansion conversations. Fix retention fundamentals first.
Mistake 6: Not Investing Enough in Customer Success
The problem: Treating customer success as a cost center rather than a growth driver leads to under-resourcing and poor outcomes.
The fix: View CS as revenue-generating. Companies with robust CS functions see 10-20 percentage point higher NRR.
The Future of Net Revenue Retention
AI-Driven Predictive Retention
Advanced AI will predict churn with increasing accuracy:
- Real-time health scoring based on hundreds of behavioral signals
- Predictive models identifying at-risk customers 6-12 months before churn
- Automated interventions triggered by AI-detected patterns
- Personalized retention strategies optimized per customer segment
Product-Led Expansion at Scale
The future of expansion is increasingly product-led:
- In-app upgrade prompts triggered by usage patterns
- Automated trial-to-paid conversions for premium features
- Usage-based pricing that scales naturally with customer growth
- Self-service expansion reducing dependency on sales teams
Integration of NRR Across the Organization
NRR will become a company-wide metric, not just a CS responsibility:
- Product teams measured on feature adoption and expansion
- Engineering teams incentivized on product quality affecting retention
- Marketing responsible for setting accurate expectations
- Sales compensated on multi-year deals that improve GRR
Real-Time NRR Monitoring and Intervention
Future platforms will enable:
- Daily NRR tracking instead of monthly calculations
- Instant alerts when customers exhibit churn signals
- Automated playbooks executed the moment health scores decline
- Predictive NRR forecasting for better planning
Frequently Asked Questions About Net Revenue Retention
How do you track NRR when your billing system doesn't calculate it automatically?
Pull data from your billing platform (Stripe, Chargebee), CRM (upgrades/downgrades), and customer success tools (churn data). Start with a spreadsheet to track monthly cohorts, then move to dedicated tools like ChartMogul, Baremetrics, or ProfitWell as you scale. The key is tracking the same customers over time and categorizing revenue changes correctly.
When should SaaS companies prioritize NRR improvement over new customer acquisition?
Once you have 50-100 paying customers and solid product-market fit. If your NRR is below 100%, focus immediately on retention since you're losing revenue faster than you can replace it. Even with good NRR (110%+), most successful SaaS companies allocate 60-70% of growth efforts to retention at scale since it's 5x more cost-effective than acquisition.
Who should be responsible for Net Revenue Retention in a SaaS organization?
In small companies (under 50 employees), typically the founder or head of customer success. As you grow, NRR becomes shared: customer success (preventing churn), sales (expansion), and product (retention features). Many companies assign a dedicated revenue operations person to track NRR across teams. The key is ensuring someone owns visibility into the entire customer lifecycle.
What are typical Net Revenue Retention benchmarks by industry and company size?
Enterprise software: 120-150% NRR. SMB-focused tools: 100-115%. Vertical SaaS (healthcare, legal): often higher due to specialization. While 106% median is a good baseline, find benchmarks specific to your segment. Check reports from OpenView, Bessemer, SaaS Capital, and Benchmarkit for granular data by ACV and company size.
How long does it take to see results from NRR improvement initiatives?
Customer support improvements show results in 30-60 days. NRR itself takes 3-6 months to reflect meaningful changes since it's a lagging indicator. Churn prevention appears in 60-90 days, while expansion revenue takes 6-12 months to significantly impact NRR. Track leading indicators (customer health scores, time-to-resolution, expansion pipeline) to monitor progress before it shows in NRR.
Should I focus on improving GRR or driving expansion revenue first?
Fix retention (GRR) first. If GRR is below 85%, you have a leaky bucket - expansion just masks the problem. Focus on reducing churn and downgrades until GRR reaches 90%+, then layer in expansion strategies. Strong GRR (90%+) creates sustainable high NRR, while weak GRR makes expansion gains temporary.
How do AI customer service agents improve Net Revenue Retention?
AI agents provide instant, 24/7 support that resolves issues before they escalate to churn. They handle routine inquiries constantly, letting human agents focus on high-value interactions. Companies using autonomous AI support see 20-40% faster resolution and 15-25% higher satisfaction scores, both directly improving retention. The key is ensuring AI actually resolves issues rather than just deflecting them.
What's the relationship between NRR and company valuation?
High NRR significantly boosts valuation multiples. Investors value high-NRR companies more because they demonstrate sustainable revenue without heavy acquisition spending. A company with 120% NRR might command 2-3x higher valuation than one with 95% NRR at similar growth rates. Public SaaS companies with 120%+ NRR trade at premium multiples, and private companies with strong NRR get better funding terms.
Conclusion
Net Revenue Retention has emerged as the defining metric for SaaS success in 2025. While customer acquisition dominated the growth-at-all-costs era, today's market demands sustainable, capital-efficient growth driven by existing customers.
Key takeaways:
- NRR above 110% is the new baseline for strong SaaS companies
- Companies with high NRR grow 2.5 times faster than low-NRR counterparts
- Aim for NRR of 106-115% for growth stage, 115-120%+ for scale stage
- Track GRR alongside NRR to ensure expansion isn't masking churn
- Segment NRR by customer type, ACV, and cohort for actionable insights
- Focus on retention (GRR) before pushing expansion aggressively
- Leverage AI for predictive churn prevention and instant support
Start measuring your Net Revenue Retention systematically today. Identify your biggest retention and expansion opportunities, implement targeted improvements, and watch your sustainable growth accelerate.
For software companies looking to improve NRR through AI-powered visual guidance, autonomous support, and instant issue resolution, learn more about Fullview or start your free trial.
Looking for more SaaS growth insights? Explore our guides on average churn rate for SaaS, customer retention rate, and customer support efficiency.


.webp)