Customer success metrics are crucial for turning transactions into loyalty and ensuring recurring revenue instead of churn. Measuring this success can be challenging. In a competitive landscape, true customer success is essential for growth and brand loyalty, necessitating precise tools to identify key metrics.
Key Performance Indicators (KPIs) are vital in this process, acting as a compass and map to track progress, spot challenges, and guide businesses toward loyal customer relationships.
We’ll equip you with the 20 essential customer success KPIs to track, ensuring your business thrives in the new year.
20 key customer success metrics to track in 2025
In 2025, customer expectations for hyper-personalization and seamless interactions set a high bar. It's essential to go beyond just checking boxes and know precisely which metrics to track. Emphasize data-driven decisions over guesswork to meet these evolving demands.
NPS
Net Promoter Score (NPS) is a crucial customer success KPI, measuring loyalty and enthusiasm. It's based on a single question: "On a scale of 0 to 10, how likely are you to recommend this company/product/service to a friend or colleague?"
Scoring: Calculate your score by subtracting the percentage of detractors (scores 0-6) from promoters (scores 9-10). Passives (scores 7-8) are neutral and not included in the final score.
How: Regularly survey to track your NPS. Use email, product embedding, or during customer interactions.
Pros: Benchmark using NPS to compare your loyalty score to industry norms or past performance, fueling competition and improvement.
Cons: NPS may oversimplify customer sentiment; a single score lacks depth and misses nuances of customer feelings.
CSAT
CSAT measures customer satisfaction with one key question: "How satisfied were you with this service?"
Scoring:
CSAT uses a 5-point scale (Very unsatisfied to Very satisfied), adjustable as needed. Calculate your score by averaging responses; higher scores mean higher satisfaction. Explore ways to improve your CSAT.
How: Track CSAT easily using various methods: post-interaction surveys, email/SMS surveys after key touchpoints, or embedding in your website/app for instant feedback.
Pros: The one-question CSAT format is easy for customers, encouraging high response rates and reducing survey fatigue. It links satisfaction to specific interactions, highlighting areas for improvement.
Cons: CSAT shows "what" in customer satisfaction but not "why." To understand reasons behind scores, additional research or open-ended questions are needed for a full picture
Learn more about the differences between NPS vs CSAT.
Churn
Understanding and measuring churn is vital for customer retention. Churn is the percentage of customers lost within a set timeframe, typically a month or year, and is a key KPI for SaaS companies relying on recurring business.
Scoring: Calculate churn rate by dividing the number of lost customers in a period by the total at the start, then multiply by 100. E.g., losing 10 out of 100 customers in a month equals a 10% churn rate.
How: Segment churn by customer types or acquisition channels to find improvement areas. Use exit surveys/interviews to learn why customers leave, aiding in pinpointing issues and preventing future losses.
Pros: Churn signals potential issues in customer experience or product-market fit. Monitoring churn motivates strategies to maintain customer happiness and engagement.
Cons: Additional research is needed to understand the "why" behind the numbers fully.
CES
CES (Customer Effort Score) measures the ease or difficulty customers experience when resolving issues or completing tasks with your product or service.
Scoring: You can use a 5-point scale (Very Difficult, Difficult, Neutral, Easy, Very Easy).
How: Present a simple statement like "How easy was it to use the app?" Conduct qualitative research like follow-up questions or feedback surveys to understand the reasons behind high or low effort scores.
Pros: Tracking CES prioritizes customer-centricity, ensuring your product or service is intuitive and enjoyable to use.
Cons: Individual perceptions of effort can vary, making comparisons across different customer segments or industries challenging.
Learn which is better, CSAT vs CES.
NRR
Net Revenue Retention (NRR) is a success KPI that tracks the growth of your recurring revenue from existing customers. It shows how much revenue your existing customer base is bringing.
How: Multiply the percentage of customers retained by the average revenue per customer from the previous period. Then, subtract the percentage of churned revenue (lost revenue from canceled subscriptions, etc.).
Pros: Unlike raw revenue numbers, NRR accounts for both customer retention and expansion, offering a more complete picture of your customer success efforts.
Cons: While NRR tells you how much revenue you retain, it doesn't pinpoint the reasons behind customer churn. You might lose high-value customers due to product issues, competitor offerings, or poor customer service.
Customer LTV
Customer Lifetime Value (LTV) measures the total revenue a customer is expected to generate over their entire relationship with your business.
How: Multiply the average revenue per customer by their average lifespan (in months or years), then subtract the cost of acquiring and serving them.
Pros: Monitor Lifetime Value (LTV) trends to gauge the effectiveness of customer success strategies and pinpoint areas needing improvement. LTV serves as a metric for evaluating each customer's overall value, informing decisions in pricing, marketing, and product development.
Cons: Lifetime Value (LTV) is an estimate, dependent on assumptions about future customer behavior. This can be affected by market shifts, competitor actions, and evolving customer preferences.
Expansion revenue
Expansion revenue comes from upselling, cross-selling, or convincing existing customers to upgrade their plans.
How: Compare the overall increase in recurring revenue from existing customers over a specific period, identifying the portion attributed to upsells, cross-sells, and plan upgrades.
Pros: Expanding with existing customers is typically more cost-effective than acquiring new ones, boosting your profit margins.
Cons: Focusing only on growth can ignore customer churn, giving a misleading sense of progress. Aggressive upselling not matching customer needs can increase churn and frustration.
Volume of support tickets
It's the total number of requests for assistance that your support team receives within a specific period.
How: Use your helpdesk system to track daily, weekly, or monthly tickets. Categorize tickets by type (technical, billing, feature requests) to identify common issues.
Pros: Track ticket volume to assess support team effectiveness and find improvement areas. A spike in tickets can signal product issues, customer frustrations, or support resource gaps.
Cons: Ticket volume might not capture all customer feedback, such as those who abandon their efforts or seek help elsewhere.
Average revenue per user
It shows the average revenue per user. Unlike Customer LTV, it doesn't account for the cost of acquiring and serving a customer.
How: Divide your total revenue by the number of active users during that period.
Pros: It indicates the value gained from each user, aiding in pricing strategies and product development. It also identifies high-value customer segments for retention and growth focus.
Cons: A few high-paying customers can skew ARPU, masking the performance of the broader customer base.
Conversion rate
Conversion rate is a success KPI that measures the percentage of visitors who perform a desired action on your website, app, or campaign, like converting from a free trial to a paid plan or from a new user to an activated user.
How: Calculate conversion rate by dividing conversions (purchases, signups, downloads) by total visitors and multiplying by 100. Use heatmaps and session replays to analyze user interactions and pinpoint funnel bottlenecks. Fullview is a notable app offering these features.
Pros: It shows the effectiveness of your marketing and website design in turning visitors into customers. Use A/B testing to experiment with website variations and assess their impact on conversion rates.
Cons: A high conversion rate doesn't guarantee profitability if acquisition costs are too high or customer lifetime value is low.
Customer health score
The Customer Health Score (CHS) is a key success KPI, not medical, indicating a customer's overall engagement, satisfaction, and churn risk.
How: CHS includes data like purchase history, support interactions, product usage, NPS scores, and CSAT feedback. Different metrics vary in importance depending on your business model and customer journey. Assign weights to reflect their significance.
Pros: CHS flags at-risk customers before they churn, letting you take proactive steps to re-engage and retain them.
Cons: Collecting and integrating multi-source data is complex and costly, needing strong systems. It doesn't replace in-depth qualitative customer research or personalized outreach.
Customer retention cost
It's the spending on strategies to retain customers and prevent churn. Investing in retention is often more cost-effective than acquiring new customers.
How:
To calculate customer retention cost, first identify all associated costs, including discounts, loyalty programs, customer support, account management, and proactive outreach. Then, divide the total retention costs by the number of customers retained in a specific period.
Pros: Retained customers create a more stable and predictable revenue stream, supporting business growth.
Cons: Focusing solely on retention can lead to neglecting new customer acquisition, limiting growth potential.
Qualitative customer feedback
Qualitative customer feedback isn't just data points and graphs – it's the voice of your customers telling exactly what they feel.
How: Use surveys with open-ended questions or encourage written reviews and testimonials. Identify recurring themes, pain points, and areas for improvement.
Pros: Qualitative customer feedback reveals the "why" behind customer behavior, driving deeper understanding.
Cons: Collecting and analyzing qualitative feedback can be time-consuming and require skilled personnel.
FCR
The first contact resolution rate tracks how often customer issues are fully resolved on their first interaction with your support team.
How: Divide the number of issues resolved on the first contact by the total number of contacts, then multiply by 100.
Pros: Resolving issues quickly and efficiently boosts satisfaction and loyalty. It also means lower support costs and more efficient use of resources.
Cons: Overemphasis on it can lead to rushed interactions and sacrificing quality for speed.
Features like live chat can help raise your FCR.
MAU/DAU/WAU
MAU refers to the total number of unique users interacting with your product or service at least once a month. You may also track DAU (Daily Active Users) or WAU (Weekly Active Users) based on your product or service.
How: Incorporate tools into your product or website to gather usage data and track metrics like MAU, DAU, or WAU. Define what qualifies as an "active user" in your business context, such as login, page view, or feature usage.
Pros: Assess overall usage and your product's stickiness to understand usage frequency and preferred features. This information can guide product development and marketing strategies.
Cons: Active user count doesn't reveal user motivations or satisfaction levels.
Average session duration
It's a key metric that measures the average time users spend actively interacting within a single session.
How: Use tools like Google Analytics to track session lengths automatically. Calculate the average session duration by dividing the total time spent on your site or app by the total number of sessions in a specific period.
Pros: Longer sessions often indicate greater interest and engagement with your content or features.
Cons: Long sessions may include idle time or multitasking, rather than active engagement. Factors like device type, internet speed, and distractions can influence session lengths.
Product usage rate
This product metric shows how often and actively your customers engage with your app’s features and functionalities.
How: Implement tools to track user behavior and gather usage data in your product or website. Define active usage criteria based on your product's nature and goals, such as logins, feature interactions, or task completions.
Pros: Uncovers which features are most used and valued to guide product development.
Cons: Usage rates alone don't reveal user motivations or satisfaction levels.
Repeat Purchase Ratio
The Repeat Purchase Ratio gauges the frequency of customers returning for more purchases, reflecting customer loyalty and satisfaction and their likelihood of repurchasing.
How: Integrate tools into your e-commerce platform or CRM system to automate tracking and reporting.
Pros: High RPR suggests a strong customer base that values your products or services.
Cons: RPR alone doesn't explain why customers are repeat purchasing (e.g., satisfaction, convenience, lack of alternatives).
Upsells and cross-sells
Upselling involves persuading customers to buy a higher-tier version of a product or service with more features or benefits. Cross-selling recommends complementary products or services that enhance the experience with the initial purchase.
How: Track the percentage of customers who accept upsell or cross-sell offers to assess their effectiveness.
Pros: Tailored recommendations can add value and enhance the customer experience.
Cons: Focusing solely on revenue can lead to offering unnecessary products.
Subscription renewal rate
This metric measures the percentage of customers who renew their subscriptions after an initial period, indicating their satisfaction and loyalty to your product or service.
How: Divide the number of customers who renewed their subscriptions within a specific period by the total number of customers eligible for renewal, then multiply by 100.
Pros: High renewal rates reflect satisfied customers who value your offerings and will likely become brand advocates.
Cons: High overall renewal rates might conceal churn within specific segments or plans, requiring deeper analysis.
Raising Your KPIs
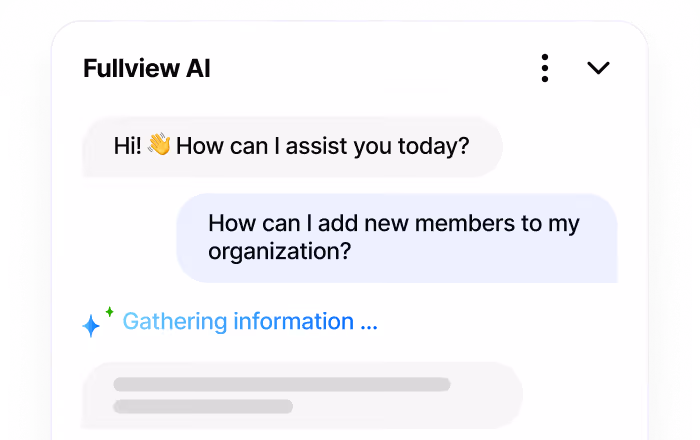
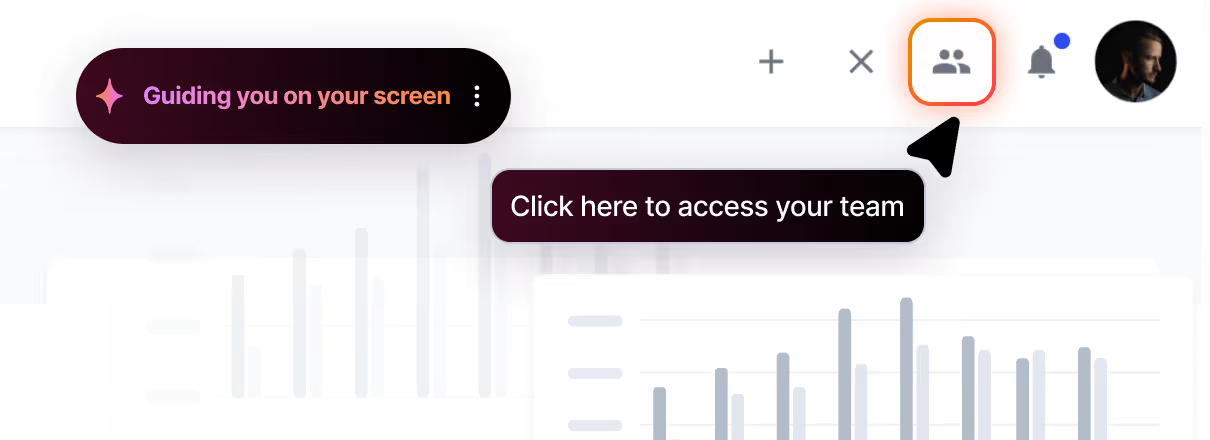
Improving customer success involves understanding key metrics that guide you toward stronger customer relationships and sustainable growth rather than relying on luck. Using a cobrowsing and session replays app like Fullview is one of the best customer support practices to improve these KPIs.
With cobrowsing, success managers can initiate zero-download screen control sessions with users in their app to guide them on screen, help them get value from the product, and improve the onboarding experience. Fullview's session replay feature allows you to record and observe customer interactions with your website or app. Analyze their clicks, hesitations, and issues to pinpoint friction points and improve user journeys.
Unlock the full potential of your business and witness your customer success metrics blossom with the help of Fullview today. You can take an interactive tour here.
.png)


.webp)